Thursday, August 28, 2008

A15 - Color Image Processing

A colored digital image is an array of pixels each having red, green and blue light overlaid in various proportions. Per pixel, the color captured by a digital color camera is an integral of the product of the spectral power distribution of the incident light source S(λ), the surface reflectance r(λ) and the spectral sensitivity of the camera η(λ).

Each pixel in a color image has R, G, B values, each of which has a balancing constant equal to the inverse of the camera output when the camera is shown a white object. This balancing constant is implemented through white balancing algorithm of a digital camera.
At its simplest - the reason we adjust white balance is to get the colors in your images as accurate as possible.*

More on white balancing at this link. *

---
The following images shows the effect of changing white balance on camera settings


WB: auto

sunny and cloudy settings

fluorescent and tungsten settings

From these images, we can obviously account that white doesn't appear white especially in tungsten settings. We therefore correct this image using the two algorithms we describe below.

---

AUTOMATIC WHITE BALANCING ALGORITHMS

There are two popular algorithms of achieving automatic white balance. The first is Reference White Algorithm and the second is the Gray World Algorithm.

In the Reference White Algorithm, you capture an image using an unbalanced camera and use the RGB values of a known white object as the divider.

In the Gray World Algorithm, it is assumed that the average color of the world is
gray. Gray is part of the family of white, as is black. Therefore, if you know the RGB of a gray object, it is essentially the RGB of white up to a constant factor. Thus, to get the balancing constants, you take the average red, green and blue value of the captured image and utilize them as the balancing constants.


original image (tungsten WB)


reference white algorithm

gray world algorithm

As can be seen from the images, the reference white is superior in terms of image quality. This is because in gray world algorithm, averaging channels puts bias to colors that are not abundant.
---

We also test this algorithm for an image with objects of the same hue.


original image (green objects under tungsten WB settings)

reference white algorithm

gray world algorithm

In these images, we see that the gray world algorithm is superior in terms of producing accurate colors. The green objects looks more green than in the reference algorithm.
---
Note: All images may look dark. This is because I used 0.7 exposure value to avoid saturation of images after processing them.

I give myself a 10 for I implemented the algorithms correctly. :)

---
Thanks to VIP's digital SLR camera. *nakisingit po ako sa experiment ni Ate Loren.*

Monday, August 25, 2008

A14 - Stereometry

Stereometry is another 3D reconstruction algorithm based on the human eye perception of depth. We perceive depth by viewing the same object at two different angles (two eyes separated by some distance).

In this activity, we explore how stereometry works. We try to reconstruct a 3D object using 2 images of taken by the same camera at the same distance z from the object but with a different x position (assuming x is the parallel axis between the camera and the object).


From this diagram, by simple ratio and proportion, depth z is perceived using the relation
(1)

If done on several points, we can reconstruct the 3D surface of the object.

The sample I used is a rubik's cube shown below with the tsai grid. (b=50mm, refer to diagram)


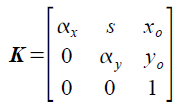
The camera used was first calibrated to get its internal parameter f (focal length). From the a's calculated using Activity 11 – Camera Calibration, matrix A is formed by recasting the a's. We then get the values of matrix A(1:3,1:3) and factorize this using RQ factorization, to get upper diagonal matrix K. (Note: Ensure that the factorized A(3,3) element is 1 by dividing the matrix by K(3,3)). The K-matrix obtained is shown below.


Knowing that K is just

and
we now have a value for focal length f (let kx=1);

We then get z values (using the equation 1) for different points on the object (purple dots).


Reconstruction was done using Matlab's griddata instead of SciLab's splin2d because of the latter's initial requirement of increasing values for both x and y image coordinates. Matlab's griddata function, however, works well for random values of x and y image coordinates.

Reconstruction of the rubik's cube is shown below.


It may not seem obvious but the reconstruction obtained the general height difference of the points selected. The edges are not defined but it somehow approximates the shape of the rubik's cube.

---
Thanks Cole for helping me with the images and JC for the discussions with regards to reconstruction.

---
Rating 6/10 since
1. reconstruction is not that good
2. I used Matlab in reconstruction rather than SciLab
3. I posted this blog very late.

Wednesday, August 6, 2008

A13 - Photometric Stereo

Photometric stereo is an algorithm for obtaining local surface orientation by using several images of a surface taken under different illumination conditions with the camera viewpoint held fixed.

The technique assumes that intensity I captured by camera at point (x,y) is directly proportional to brightness of surface at that point. This also assumes that light rays arriving on the surface are parallel. Shape of the surface is estimated from the multiple images and the information about the surface is coded in the shadings obtained from the images.

In this activity, we use Photometric Stereo technique to obtain a 3D reconstruction from 2D images. The input images are shown below.

The intensity at each point is denoted in matrix form as

Knowing the light source directions (V) for each of the input images (I), we use the equation below to solve for g.

From the computed values of g (a 3 row matrix corresponding to the xyz locations), we get a normal vector by dividing each element in a column with the magnitude of that column. After this, a linear integral was used to obtain the z values. Plotting z with a 128x128 plane yields the following 3D reconstruction.

---
Rating: 10/10 for the accurate reconstruction of the shape of the input images using the algorithm