CLOSING and OPENING Morphological Operations
Opening is defined as an erosion followed by a dilation using the same structuring element for both operations. The basic effect of opening is somewhat like erosion in that it tends to remove some of the foreground (bright) pixels from the edges of regions of foreground pixels, but is less destructive. ***
Closing is defined as a dilation followed by an erosion using the same structuring element for both operations. Closing is similar in some ways to dilation in that it tends to enlarge the boundaries of foreground (bright) regions in an image (and shrink background color holes in such regions), but it is less destructive of the original boundary shape. ***

Getting Cell Area
The above image was first sampled by cropping 256x256 images. This was done because of two reasons. One is to save memory space since working with large images correspond to larger memory and two is to obtain an accurate value for the cell area by sampling on different regions of the image.
Below is a 256x256 cropped image. We first binarized this image to simplify the separation of background from region of interest (ROI). The optimum threshold can be found by examining the histogram of this image.
Below is a 256x256 cropped image. We first binarized this image to simplify the separation of background from region of interest (ROI). The optimum threshold can be found by examining the histogram of this image.
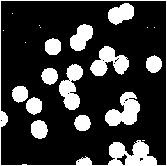
The binarized image is shown below.

Performing OPENING on the image results to the following image. The white pixels which are part of the background were removed.

Performing CLOSING operation results to the image below. Separation of touching blobs were observed.
We then use bwlabel function in SciLab to returns an image matrix which is of the same size as the original image but now containing labels for the connected objects in it. From this matrix, we can get the area of the cells since the each blob is a set of connected pixels.
We repeated the above procedures for different sample images and obtained a histogram of the cell area.
From this histogram, we can deduce that the pixel area of a cell in the image has a value between 500-550 pixels. Reducing the x-axis to 450-550 pixels shows the following histogram. This was done to limit the calculated area to those that best represents the cell area, since bins with smaller values can be accounted to small connected components, which is unlikely area of the cell.

We then get the mean and the standard deviation of the cell area obtained. The values were
area = 521.84444 pixels
std dev = 20.685915
We then checked if this values are correct. This was done by getting the cell area from an image with separated cells.
Clearly, these values lie within the acceptable limit for the calculated area of the cell. The mean value obtained is thus correct. :)
-o0o-
Thanks Jeric for the tips on getting the histogram of the areas obtained.
-o0o-
I give myself a 10 for I implemented the necessary techniques well.


No comments:
Post a Comment